How to Add All Your IRL Stats to One Stream Overlay (HypeRate IRL Widget)

IRL streams generate tons of Data, heart rate, speed, distance, time, calories, elevation. Most streamers show this across multiple separate overlays. HypeRate IRL Widget combines everything into one customizable dashboard.
HypeRate IRL displays up to 11 real-time metrics in a single, unified overlay. Choose which stats to show, customize the layout, and match your stream branding—all without touching code. Here's how it works.
What HypeRate IRL Widget Tracks
HypeRate IRL Widget pulls real-time data from your phone and heart rate monitor to display comprehensive IRL stream stats:
- Speed : Current speed (km/h, mph, or m/s)
- G-Force : Real-time acceleration forces across X, Y, and Z axes
- Distance : Total distance traveled during the stream
- Time : Elapsed time since stream started
- Calories Burned : Real-time calorie expenditure
- Elevation : Current altitude and elevation gain
- Temperatur & UV Index : Current temperature and sun exposure level
- Rain Probability : Likelihood of precipitation at the current location
- Wind Speed : Current wind speed, optionally including gusts
Choose to display all metrics or just the ones relevant to your content. Every stat updates live as you move.
Display Modes
HypeRate IRL Widget offers two layout modes:
Single Widget Mode: Display one stat at a time in a large, bold format. Perfect for minimalist overlays or when you want to emphasize one metric (like heart rate during a fitness challenge).

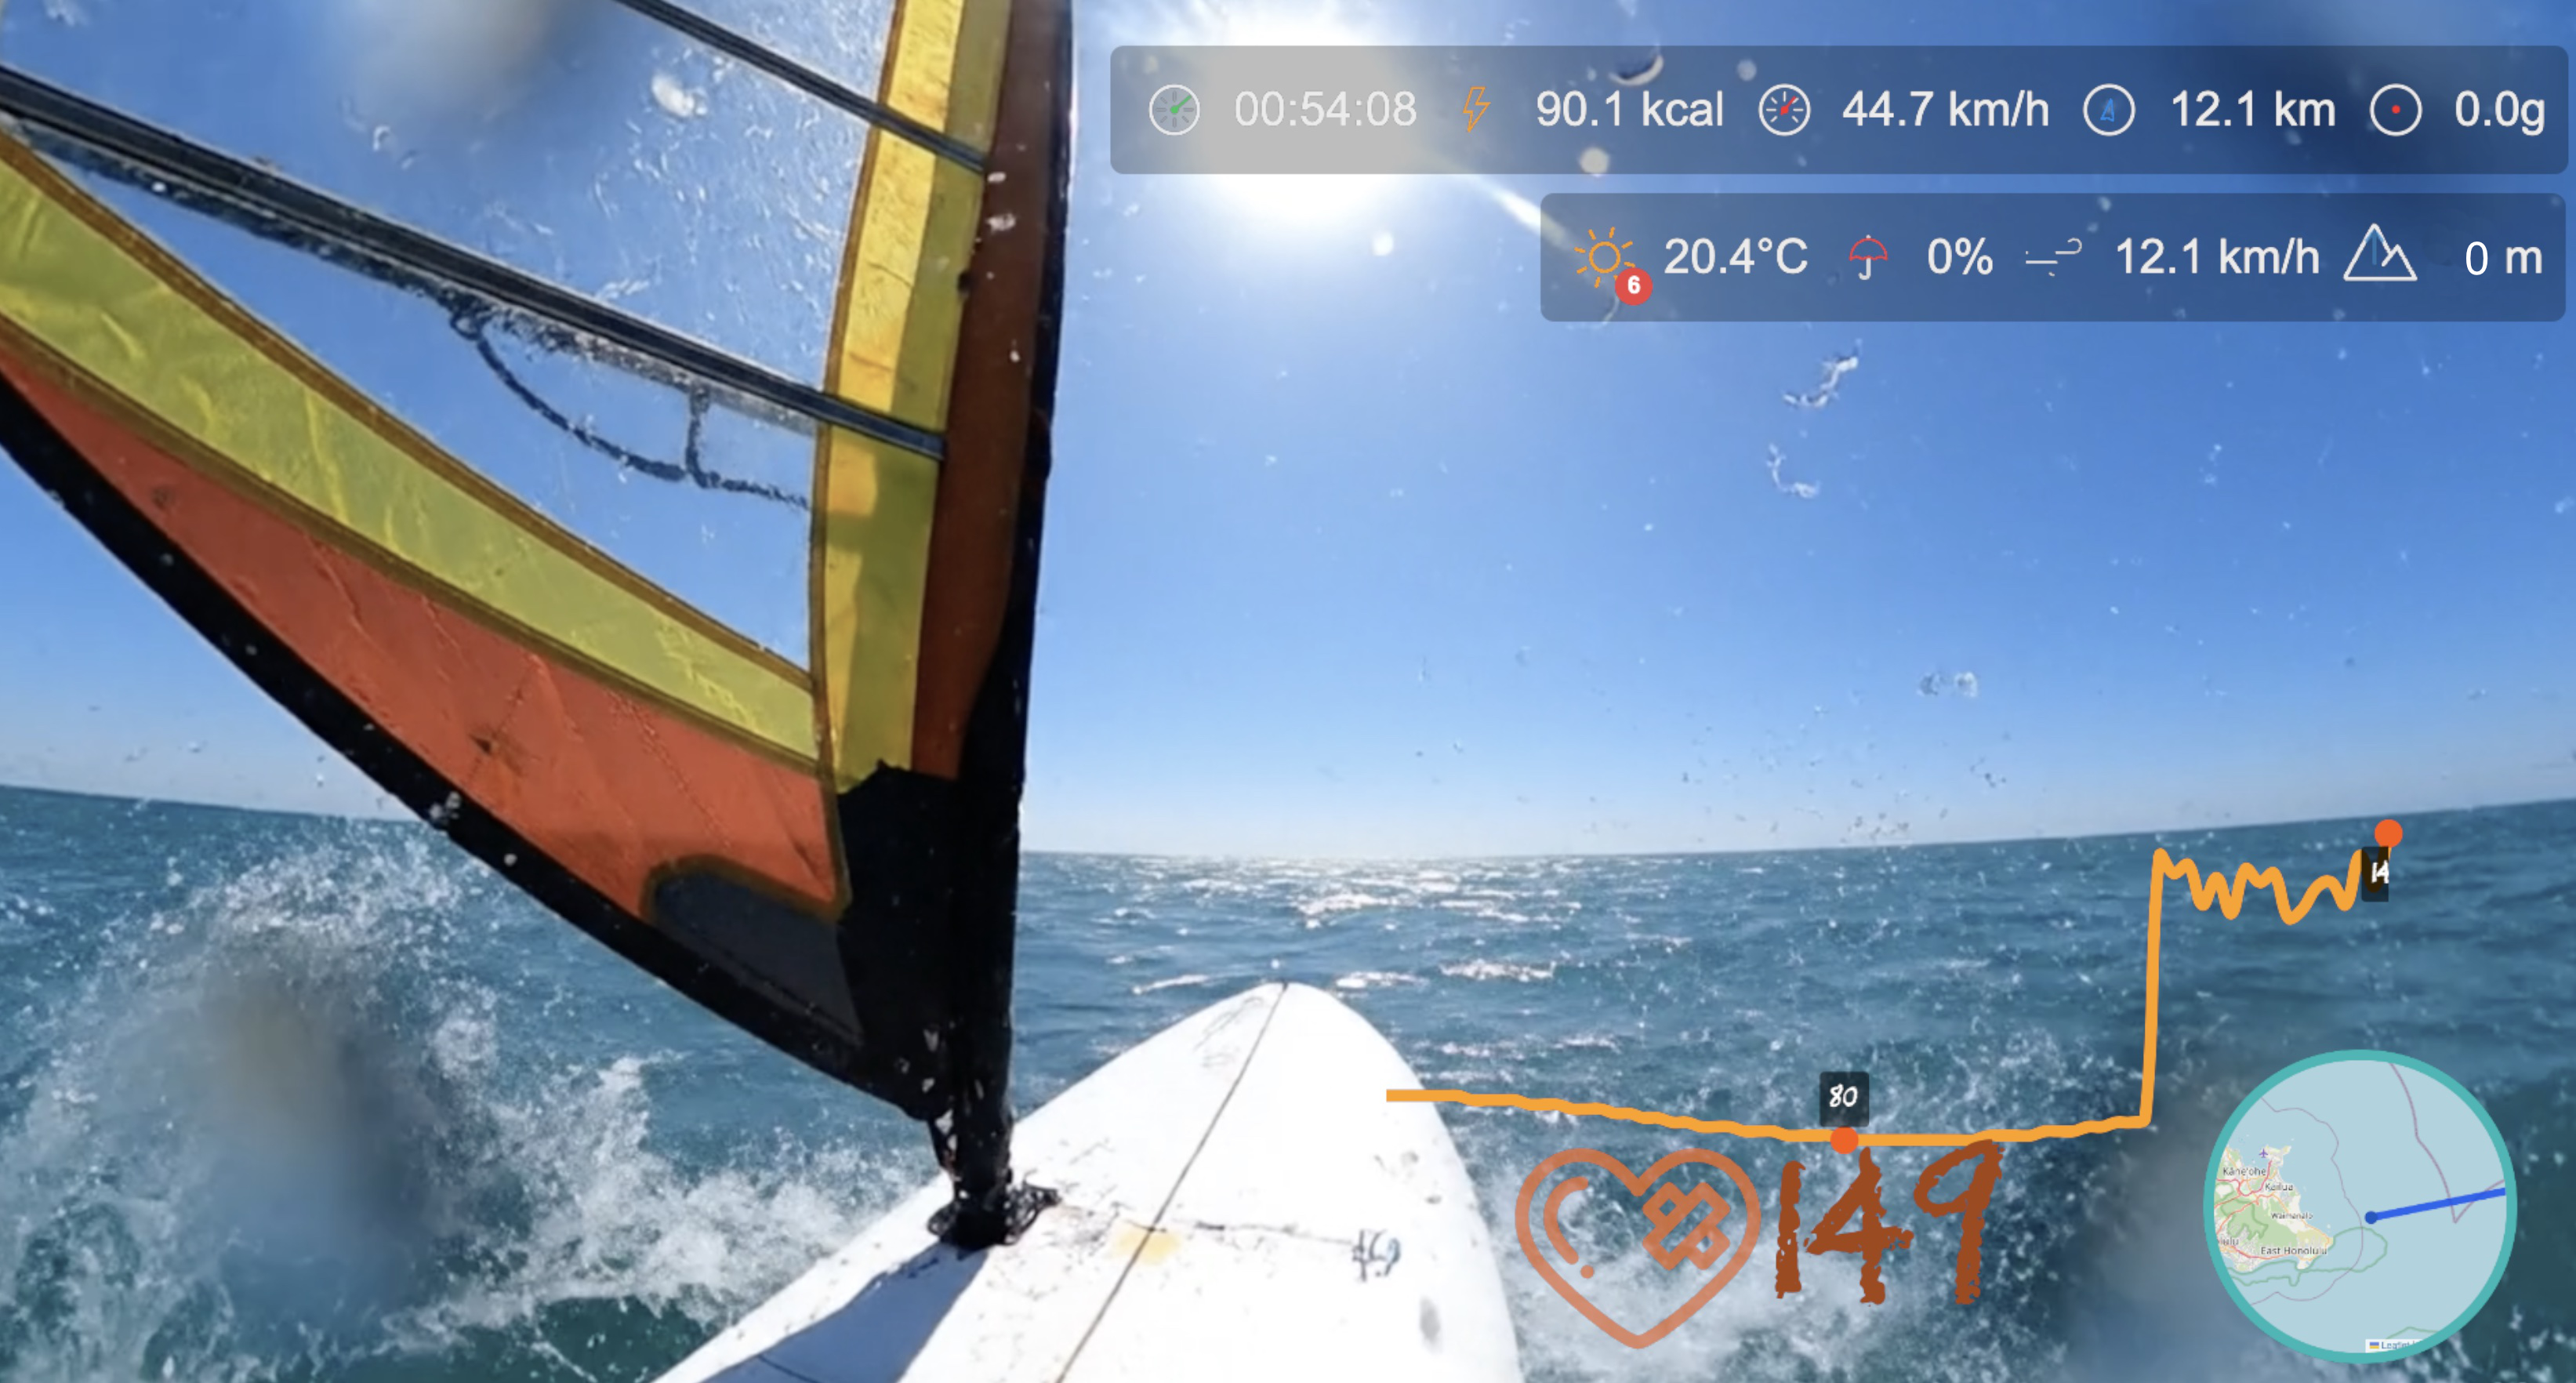
Summary View: Show multiple stats simultaneously in a compact grid layout. Ideal for IRL streams where viewers need to see speed, heart rate, distance, and time all at once.

Customization Options
HypeRate IRL Widget is fully customizable to match your stream aesthetic:
- Display Icon: Toggle metric icons on/off
- Reverse Layout: Flip the layout direction (icon/label/value order)
- Gap: Adjust spacing between elements (0-10 units)
- Icon Style: Choose between animated or static icons
- Select Metrics: Pick which stats to display (time, calories, speed, distance, heart rate, elevation, steps, etc.)
- Text Color: Customize label and value text colors
- Background Color: Set widget background (with opacity control)
- Border Settings: Adjust border color, width, and radius
Setup (60 Seconds)
Step 1: Get Your IRL Widget Link
- Open HypeRate app on your phone (iOS) or go to irl.hyperate.io
- Enter your HypeRate device ID
- Choose display mode: Single Widget or Summary View
- Select which metrics to display
- Customize colors, layout, and icon settings
- Tap "Copy URL for OBS"
Step 2: Add to OBS
- Open OBS on your streaming PC
- Click the + under Sources → Browser
- Paste your HypeRate IRL Widget link
- Set dimensions based on your layout (recommended: 600x300px for Summary View, 300x100px for Single Widget)
- Click OK
Step 3: Go Live
- Enable GPS on your phone (required for speed, distance, elevation)
- Connect Bluetooth heart rate monitor (if tracking HR)
- Start your IRL activity
- All metrics appear live on stream automatically
- Done
The widget works anywhere your phone has GPS and cellular/WiFi connectivity.
Use Cases
Cycling Streams: Display speed, heart rate, distance, and elevation gain simultaneously. When you hit a climb, viewers see your speed drop, heart rate spike, and elevation increase—all in real-time. Combine with Live Map to show your route alongside stats.
Running Content: Show pace, calories, heart rate, and distance. Summary View gives viewers complete visibility into your workout intensity. When you sprint, every metric reacts instantly—speed climbs, heart rate spikes, calories accelerate.
Fitness Challenges: "Burn 500 calories on stream" or "Keep heart rate above 150 BPM for 20 minutes" become visually trackable. Viewers watch your calorie counter or heart rate climb toward the goal in real-time.
Urban Exploration: Display time, distance, and speed while exploring new areas. Summary View shows how far you've walked, how long you've been out, and your current pace—perfect for marathon walk streams or city tours.
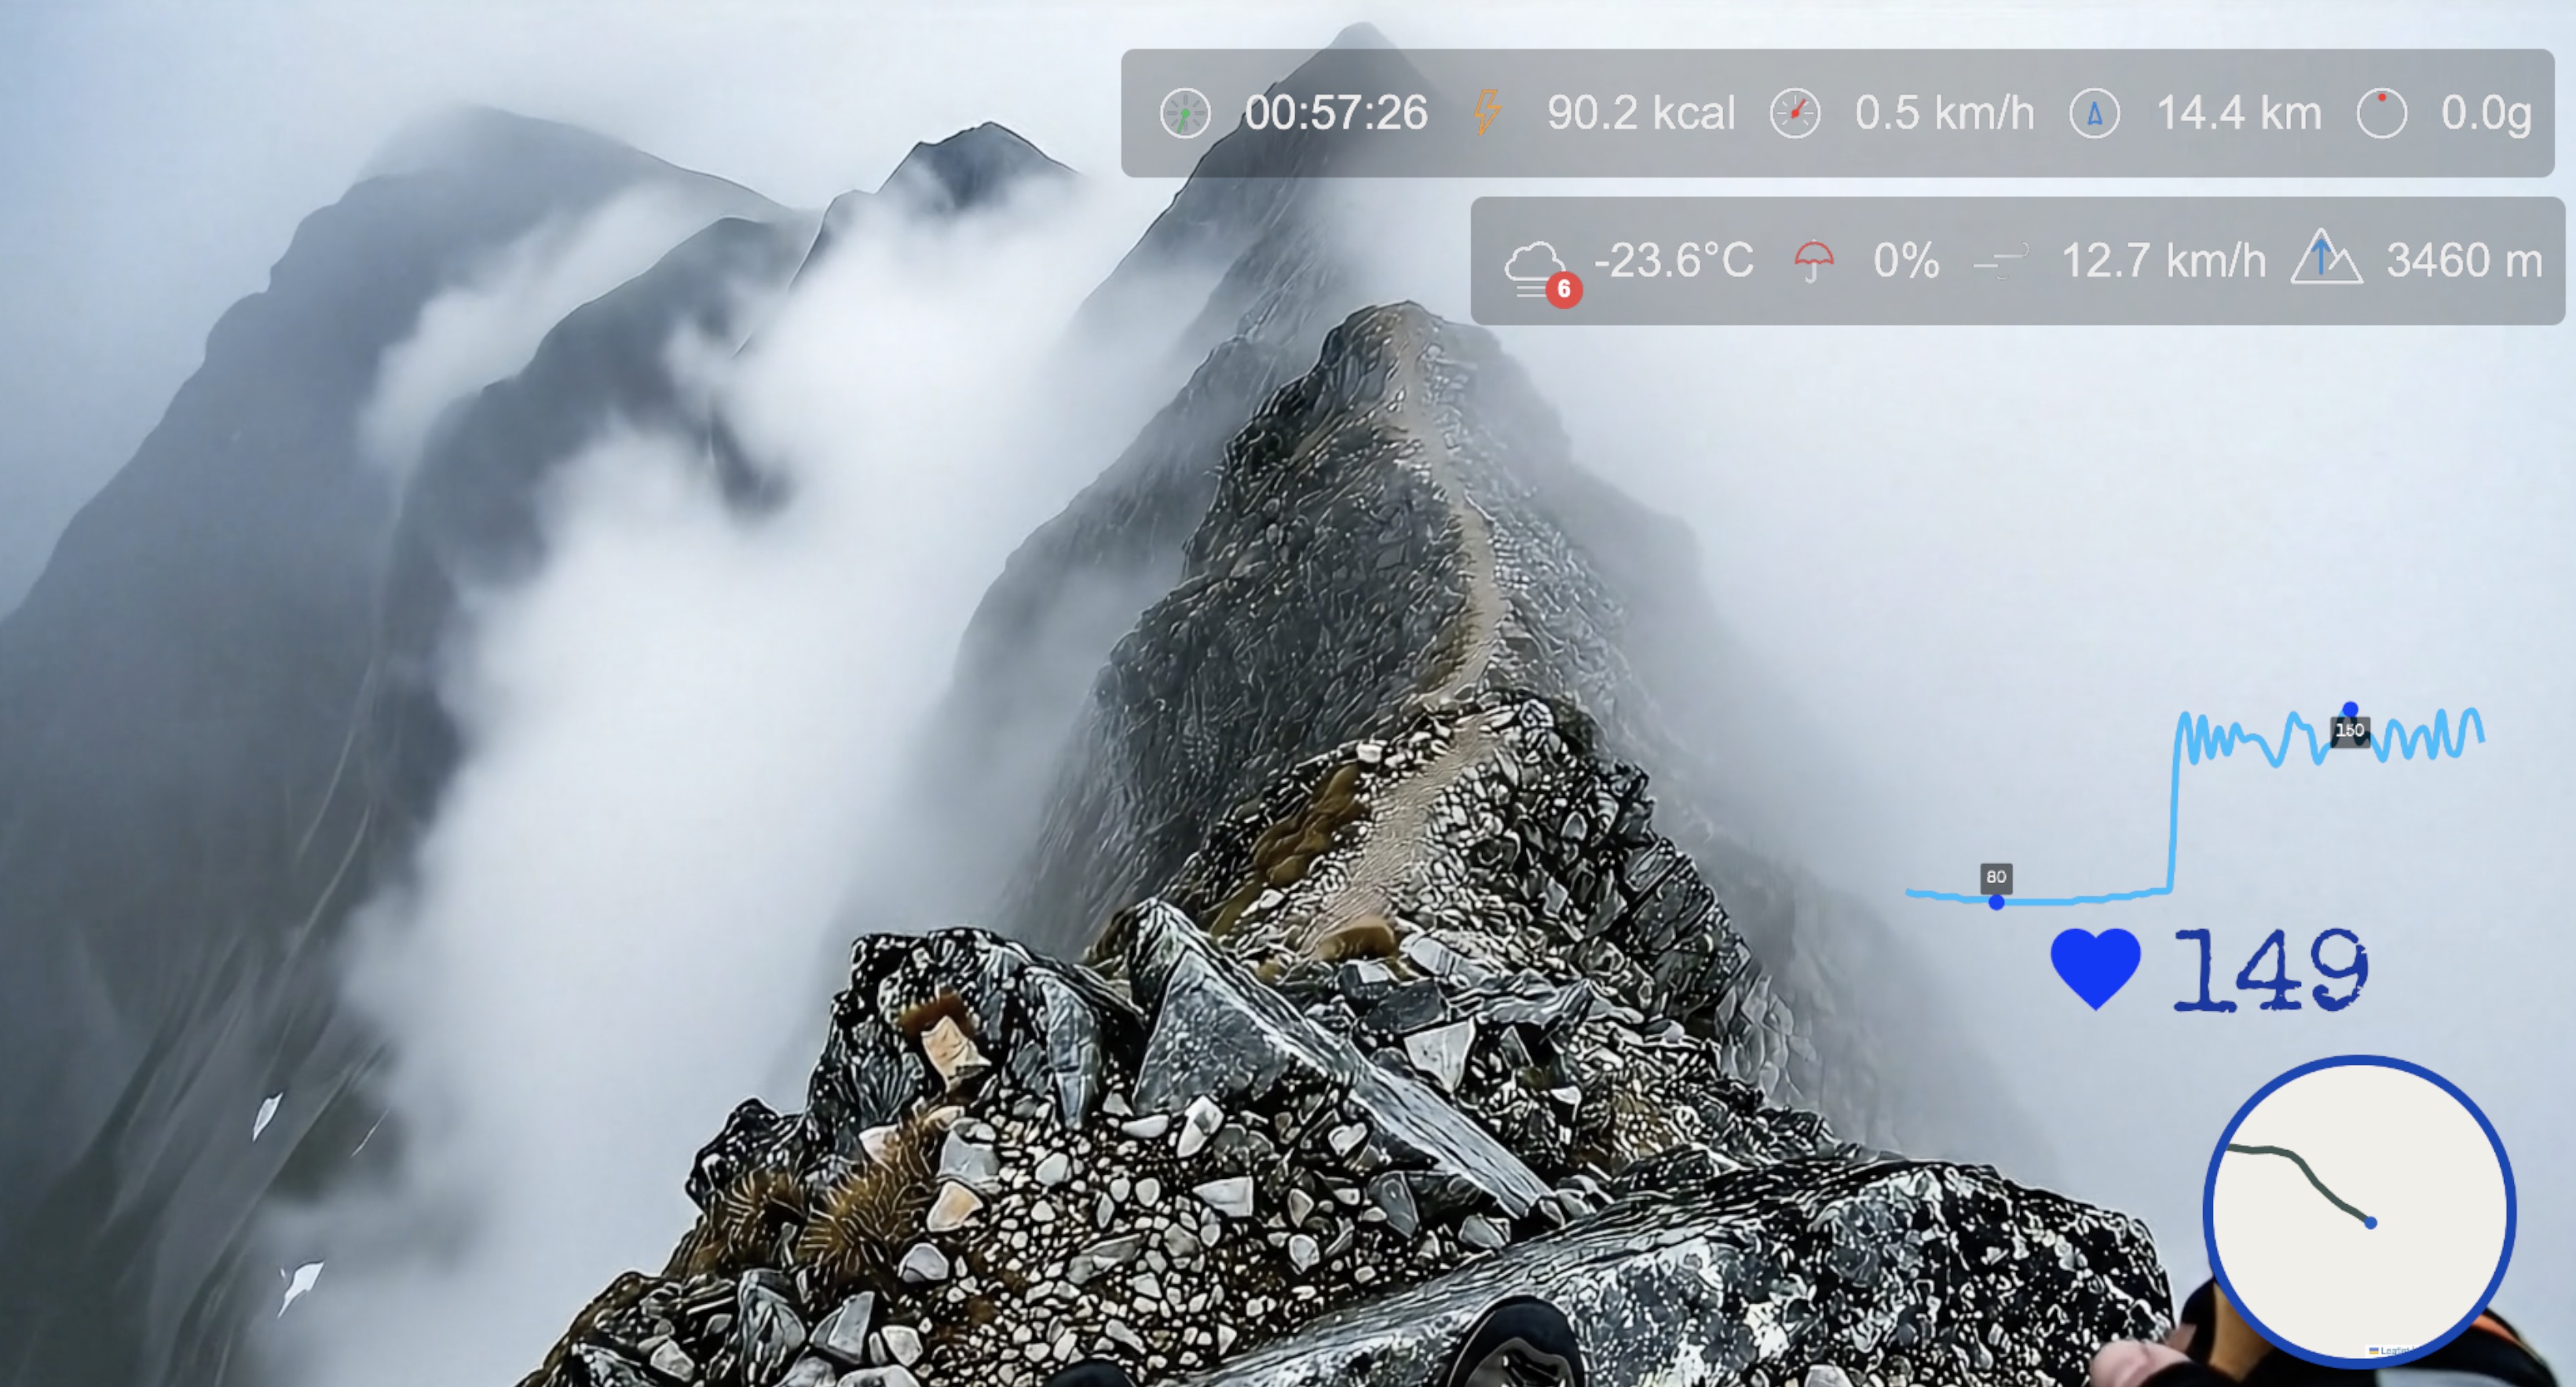
Adventure Streams: Track elevation gain during hikes, mountain climbs, or off-road biking. Viewers see exactly how much altitude you've gained and your current elevation, adding context to challenging terrain.
Multi-Day IRL Events: Long-distance cycling, bikepacking, or walking challenges benefit from persistent stats. Display cumulative distance, total time, and average speed across multi-hour or multi-day streams.
Single Widget vs. Summary View
Single Widget Mode works best when you want to emphasize one metric. Use it for:
- Speed challenges ("Hit 50 km/h downhill")
- Calorie burn goals ("Burn 1,000 calories on stream")
- Minimalist overlays where space is limited
Summary View excels when context requires multiple metrics. Use it for:
- Complete IRL activity tracking (speed, distance, time, elevation)
- Cycling or running streams where viewers need full workout data
- Adventure content where location stats (elevation, distance) + effort (heart rate, calories) tell the story
- Side-by-side comparisons (current vs. max speed, current vs. average heart rate)
Complete IRL Setup: Widget + Map + Heart Rate
Stack HypeRate overlays for the ultimate IRL stream:
- IRL Widget displays comprehensive real-time stats (heart rate, speed, distance, calories, elevation)
- Live Map shows your GPS location and route
- Speedometer adds a visual speed gauge
- G-Force tracks acceleration during intense moments
- Fitness Rings shows daily activity goal progress
Five browser sources in OBS, zero accounts needed. When viewers see your live stats, map location, speed climbing, and fitness rings filling simultaneously, they're watching complete real-time IRL storytelling.
Next Steps:
- Add HypeRate Live Map to show your GPS location alongside stats
- Combine with HypeRate Speedometer for visual speed display
- Stack HypeRate G-Force for cycling or motorsport content
- Add HypeRate Fitness Rings to track daily activity goals
- Explore the full widget gallery for more IRL overlay designs